Larry TV December 10, 2016
Is the screen blank? If so then you probably need to download the latest flash player.
Click below to download the latest flash player - Or Use Our Mobile Version Below
http://www.adobe.com/go/getflashplayer/
December 10, 2016 Video Transcript
 Welcome back. It's Larry TV time. December 10, 2016.
The big question is, can you stump the Trump rally? Well, not yet. But just about. Let me show you what I think is going to happen.
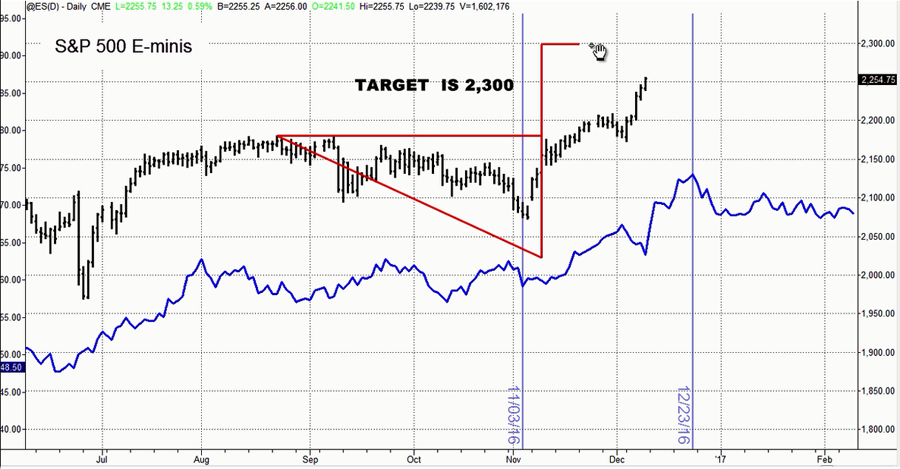
First of all, we have a target here from my old reliable target shooter. We take the high to the low and that projects a target right at 2300 in the S&P E-minis. I think we are going to go there.
Time-wise, well, the blue line you see is a forecast using interest rates. It would suggest about 12/23 [December 23]. So right around Christmas I would expect this market to start to come to the downside. But we are going to go higher. We are in a bull market. We have been talking about this for so long. It is redundant. Yet every day I read bearish news coming out. Now there is going to be a time to be bearish in 2017. But it is not here, not yet, that's for sure.
Speaking of which however, we will be releasing our 2017 forecast later this month. We have just about got it done, a few more things to do to it. So stay tuned for that.
But for now, expect higher prices in the S&P E-minis. Expect a target of 2300 and somewhere around 23rd of December, then I would look for a pullback in the market.
Okay that's stocks. Let's go look at bonds.
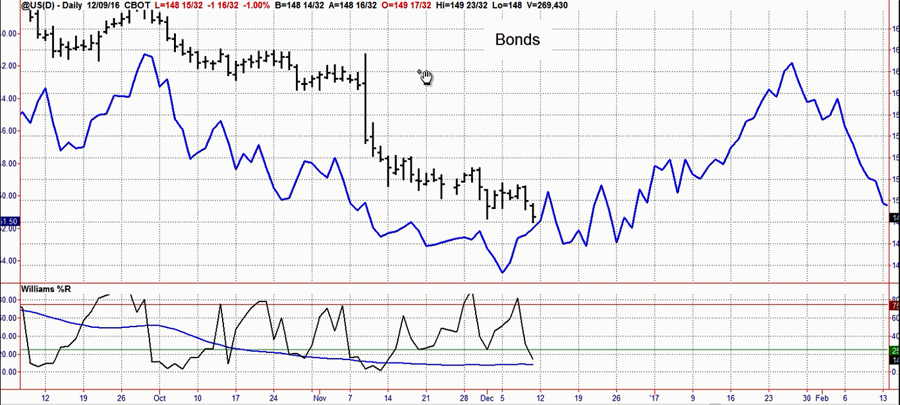 I've been in bonds and stopped out. But I want to get back in bonds. Let me show you what I think is going on. First of all, the blue line is our forecast of where bonds should be going over the next 25 to 30 trading sessions. I really like what I saw today. Potentially... we gapped down, closed lower and obviously took out any stops that were down here. Now if and only if on Monday we can get above today's for high (Fridays high) expect the market to rally. If we don't get above Friday's high on Monday but do on Tuesday, I would again take that as a buy signal. This is my old specialist trap that a lot of you know about. We are oversold in this market. The forecast is to go up. And if you look on balance volume today, we did not make a new low in on balance volume. So, the selling was not severe. So, I'm looking for a buy signal here, but we need to see Fridays high taken out to the upside. Short of that, if later on we saw the formation of a higher short-term low, that would also set up a buy point for bonds.
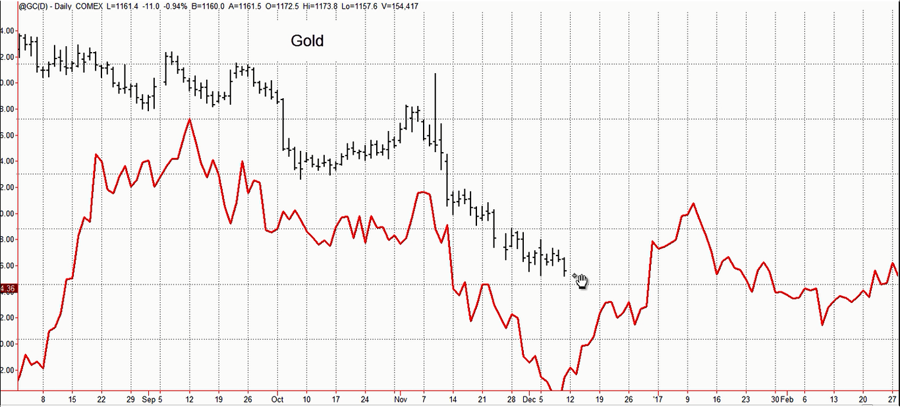 The gold market is pretty much like the bond market. Now here is our forecast is based on cycles. We had that same smashed down on Friday. And again if and only if, we get above Fridays high on Monday or if we can do it on Tuesday, that's an entry in the marketplace. Additionally, if we can make the formation of a higher short-term low, (both of these markets have moved so similarly, recently) that would be another entry technique - a higher short-term low in gold or in bonds.
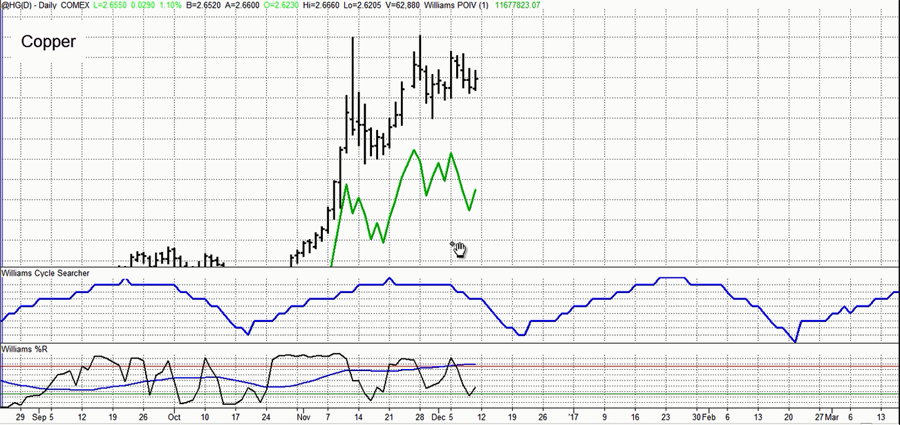 Im looking for a sell signal in copper. Here's why. The cycles say we should come down. We have been in a big uptrend. We have gone sideways here, but it looks like there has been some distribution. Our measure of accumulation here made a lower low here than back here. Price actually did not. Price is higher here than here. So it looks like there has been some distribution in this market. If we draw a trend line coming in right up here. So, getting below Friday's low would be an entry in the market. Your stop could be as high as Wednesdays high or if we had a big run up first on Monday and then came down, you could use the high of Monday. So look for and take short-term sells in copper.
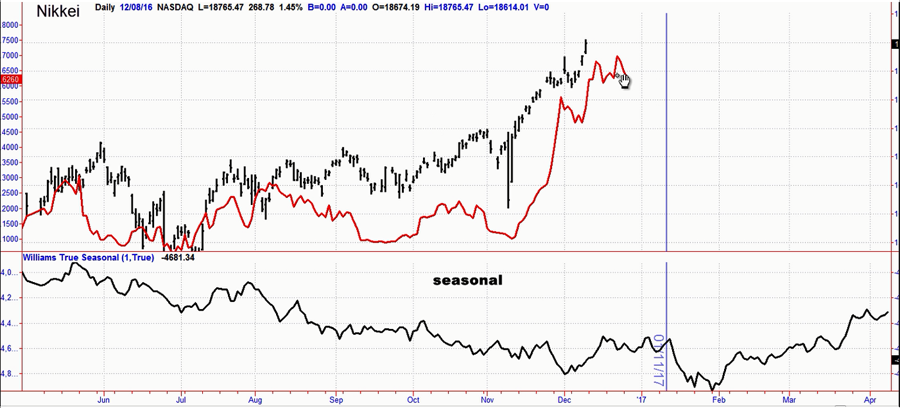 For our friends over in Japan, I continue to expect higher prices. We talked about that last weekend. It's pretty much like America. Our forecast line says it is about the 23rd of December that we are going to stop this big up move. The first of the year will probably have a little bit of a dip. In terms of how high we can go though, we could go all the way to 19,500. So, have tight trailing stops in the Nikkei or in any of your positions in Japan.
And for those who are trading the United States E-mini in Japan or those in America as well, there is a potential trade there on Monday. You could be a buyer 2.00 points [not 200] below the opening, maybe 2.50 points [not 250] below the opening. We are in a strong uptrend here. It would not be unusual to the market open, sell off a bit, and then start to rally again for a couple days. So if you want a very short-term trade, there you are. It's a real easy one. Just wait for the opening and deduct a couple hundred points and look for your buy signal there.
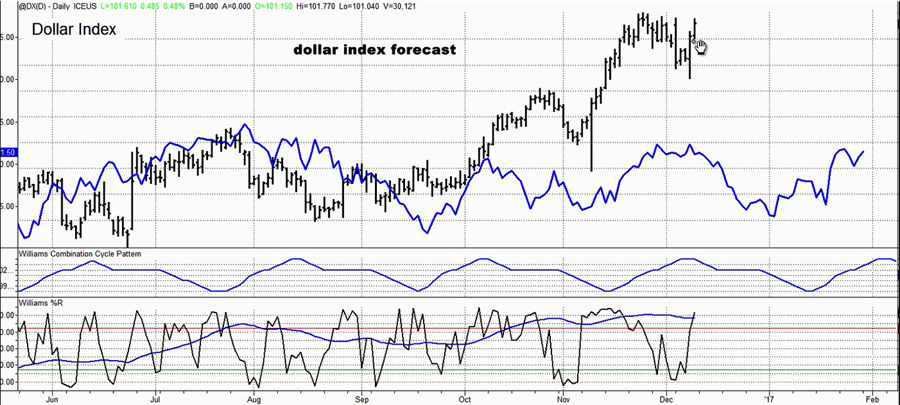 The dollar index looks surprisingly a lot like copper. If we were to get below Friday's low on Monday, in other words we form a lower short-term high here, that could set up a sell signal. After all, we are overbought in Percent R. The cycles say we should come down, and our forecast technique also says we should come down. So there is a potential sell there over the next couple of days but it has to happen right here, right now. A higher close would invalidate any selling opportunity.
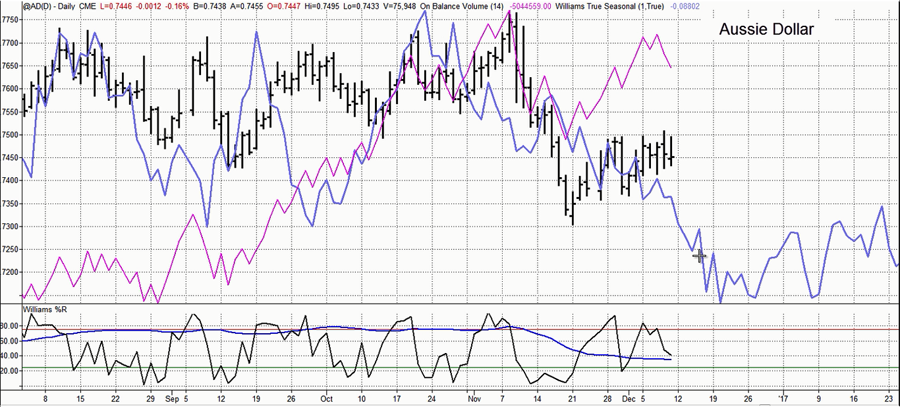 And for friends in Australian, boy we got some great friends there, I think we can see the Australian dollar go down. After all we have been in an overall downtrend market. The seasonal pattern (the blue line), it says down. We have been in a trading range here. Looks like we have blown out all the volume in the market. So getting up below a trend line in here I think represents a selling opportunity in the Australian dollar.
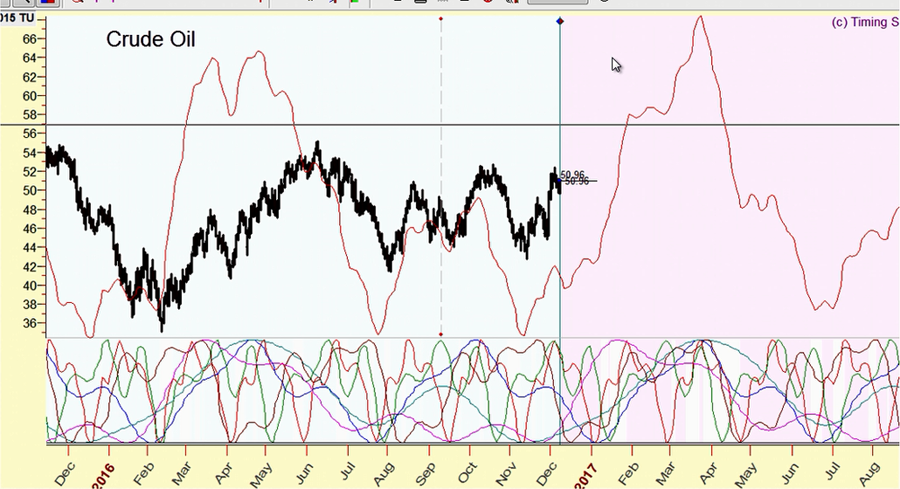 We are now looking at a chart from timing solutions software. That's the software I use for my cyclical studies. Amazing piece of software. But don't get it unless you want to do a lot of work. But you can Google timing solutions. It has been a wonderful piece of software. It is suggesting that this rally in crude oil is going to continue going higher, maybe into March. Now these are cycles. You have got to adapt these and watch them, just like your watch your kids when they're growing up. But it does suggest weve had a little pullback in here and then we move higher. So I still want to stay long with trailing stops in crude oil.
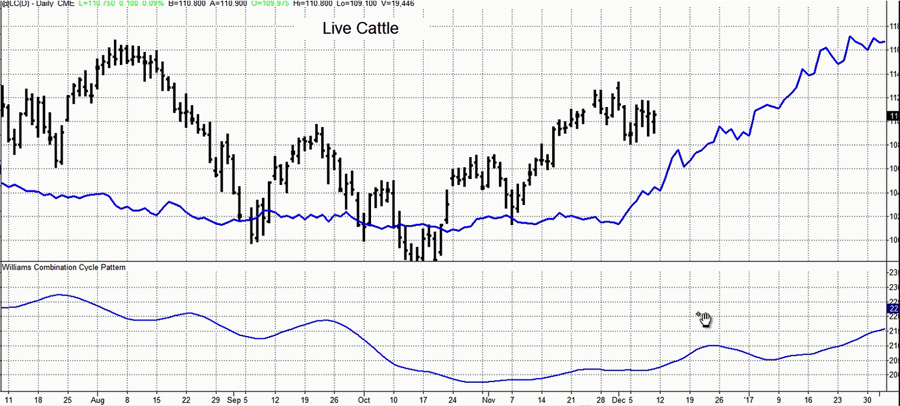 Let's not forget cattle. If we can get above of Fridays high on Monday that would suggest the formation of a higher short-term low here in a market that is projected to go higher, with cycles going up. That's a buy signal. Your stop would be Thursdays low. So look for and take buy signals in cattle.
Let's wrap it up for the grains, looking at soybeans. They really represent bean oil now - most of the grain markets. 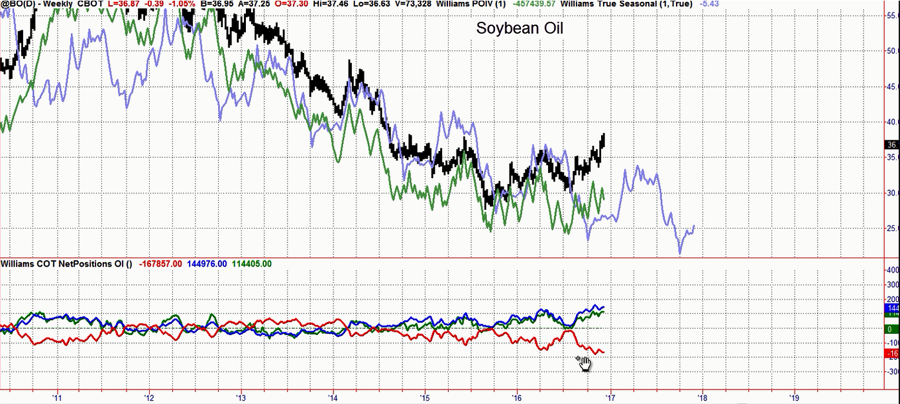 Here is what concerns me; the commercials now have a very large position on the short side. That's okay. That doesn't necessarily stop a market. But we have been in a big downtrend. The seasonal pattern is to still go up. So, I think what's going to happen is we will go higher. The strongest of the complex has been soybean oil. But make certain have tight trailing stops in this market. It should run up in here for a little bit more, but the commercial short position disturbs me. Don't give it too much breathing room.
So there you have it, and until next weekend, this is Larry Williams wishing you good luck and good trading.
 NO REPRESENTATION IS BEING MADE THAT ANY ACCOUNT WILL, OR IS LIKELY TO ACHIEVE PROFITS OR LOSSES SIMILAR TO THOSE DISCUSSED WITHIN THIS SITE, SUPPORT AND TEXTS. OUR COURSE(S), PRODUCTS AND SERVICES SHOULD BE USED AS LEARNING AIDS. IF YOU DECIDE TO INVEST REAL MONEY, ALL TRADING DECISIONS ARE YOUR OWN. OUR TRACK RECORD IS FROM TRADES GIVEN TO SUBSCRIBERS IN ADVANCE AND ARE NOT HINDSIGHT. THE RESULTS MAY HAVE UNDER-OR-OVER COMPENSATED FOR THE IMPACT, IF ANY, OF CERTAIN MARKET FACTORS, SUCH AS LACK OF LIQUIDITY. HYPOTHETICAL OR SIMULATED PERFORMANCE RESULTS HAVE CERTAIN LIMITATIONS. UNLIKE AN ACTUAL PERFORMANCE RECORD, SIMULATED RESULTS DO NOT REPRESENT ACTUAL TRADING. SIMULATED TRADING PROGRAMS ARE SUBJECT TO THE FACT THAT THEY ARE DESIGNED WITH THE BENEFIT OF HINDSIGHT. THE RISK OF LOSS IN TRADING COMMODITIES CAN BE SUBSTANTIAL. YOU SHOULD THEREFORE CAREFULLY CONSIDER WHETHER SUCH TRADING IS SUITABLE FOR YOU IN LIGHT OF YOUR FINANCIAL CONDITION.