The History Behind Williams Percent R
Before there was RSI, before there was MACD, before there was ADX... there was...
Williams Percent R or %R
Way back in the 60's when I started trading, there were no computers and market quotes were only in brokerage firms. NYSE daily volume made headlines when it topped 10,000,000 shares a day. Such heavy trading volume forced the market exchanges to close one day a week... Out of this came forth Larry Williams Percent R. Williams %R (AKA Percent R or %R) is an indicator that has stood the test of the last 45 years. It is now used by stock, futures, and commodity traders in all markets throughout the world. This is the story of the indicator... my story. After all, I created this indicator. No one knows the indicator, the story behind it or how to use it better than me.
This is the development of what is perhaps the most widely used indicator in the world, (thanks to its publication every day - on every chart - in China’s largest financial newspapers). Just about every charting software system, free or paid, has Williams %R (Percent R or %R) as an indicator you can add to your charts.
More importantly though, I’m about to show you new ways of using the indicator for today’s electronic markets; Forex or Globex, Stocks or Futures or Commodities. Something you have never seen before. You are about to learn - from the creator, from me, Larry Williams - how to use it for day trading, swing trading, even long term trading and investing.
Williams Percent R
by Larry Williams
I was young and foolish, in the battle of my life for investment survival. I was losing money then making it back, greatly frustrated with the trading and investing tools of the 1966 time period; primarily moving averages. I needed more, desperately needed it.
There was no Amazon or Internet to browse through for trading tools. My trading education as a speculator began when I was living in Portland, Oregon. J.K. Gill (Portland, Oregon’s largest book store) was the best trading education source there was... and they carried every book published on the stock or commodity markets; all 5 of them.
Barron’s was available at the local library along with a collection of old market books, and there were sellers of market books and courses of work others had done, largely in the 1930-1950 time period.
It seems like very little technical analysis was done in the 1955-1965 time. Sure there was Art Merrill’s work on filtered waves, the Granville Letter with Joe’s “Climax Indicator” and a book by Harry Schultz that was filled with wandering generalities; none of them were usable tools.
Stochastics, now a very popular tool but unknown to the public back then, was developed by Ralph Dysant at Market Educators. Later it was claimed as the work of George Lane, an office boy for Ralph.
Allan C. Davis developed a slant on Stochastics, %AC. As a purchaser of courses and such Davis sold or leased, I became aware of these tools. I looked at Stochastics but did not see that the crossovers of they called % K and % D really worked. While I liked the Over Bought/Over Sold expressed by the tool, I was not keen on the 10 day time period they used, and above all, I saw what I think they missed.
Hence I developed Percent R ( %R ) to see where today’s close was in Relationship to the Range of the last “X” time periods (note the R’s; some say I chose R as my middle name which is Richard!). I was more concerned about trend analysis of Percent R. That view was expressed in my first book, “How to Select Stocks for Immediate & Substantial Gains”, Windsor, 1967. As an aside to the story of Percent R and as inspiration to you; at the time I ventured forth into the market and developed this index I was living in a one room flat above a garage at 506 Park Street in Pacific Grove, California. A year later we had moved to California coastal gem, Carmel, nestled up against world famous Pebble Beach.
Trading with Percent R was going well...so well that people began asking for my market advice. I began a newsletter thus combining my love for the markets with my degree in Journalism from the University of Oregon. The success of the letter and additional income from trading led to the purchase the original Carmel Valley Country Club, turning it into a trading center and home. The address was Star Rout Box 30, a mile from where Joan Baez had her Peace Center (2 miles past Carmel Valley Village). Our property was eventually sold to the music team of “Earth, Wind and Fire”. That was a memorable real estate transaction; I paid $25,000 down and had $5,000 a month on the balance of $125,000!
That’s not much these days, to pay for a house, but back then it was a small fortune and the bet was I would not pay it off. If I did not the house went back to the owner. To put this into perspective the median income then was $9,400.
Here’s some more perspective; it would have cost 4,285 ounces of gold to buy the joint. Today (4/2011) that much gold is worth $6,427,500. I see on Zillow the house is now appraised at about $3,000,000.
My neighbor, Lin Eldridge, was also a trader. We went through thick and thin in our personal lives and trading, and remain buddies. Those were great years... the exuberance of youth... trading with no fear... and not much sense either! Michelle Noseworthy was my secretary, the best employee I ever had. She helped prepare our “How Seasonal Factors Influence Commodity Prices” book. Her husband Fred was a stock broker, so she understood the madness to it all.
Not all this success was due to Percent R ( %R ). I did use other tools including the Commitment of Trader Reports that Bill Meehan tutored me in so well. But, certainly much of my trading profits came from using the Percent R index. Over the years I have received hundreds of letters from traders who have turned their trading around using this tool.
I made my first $1,000,000 trading by the time I was 30 and, as Lin still reminds, we celebrated with a “retirement” dinner. What a joke that was; to think that at 30 I could retire... I did not know then just how much the markets had captured my heart and soul.
Lin and I once talked about, back then, that if we had $250,000 socked away and earned 10% a year trading we would be set for life. $25,000 a year was a King’s Ransom; I bought a brand new four-door Mercedes in 1970 for $5,600, and I think that included the California 3% or 4% sales tax. Today it would be 8.5%... the tax on a new Mercedes is now more than what I paid for my first one!
Original Williams %R
The following excerpt is from my book “How I Made One Million Dollars... Last Year... Trading Commodities”. The book was written in 1973, and it was the first time I made public my indicator that I had been using since I first started trading futures, stocks, and commodities in 1966.
HOW TO TELL WHEN A COMMODITY IS OVERSOLD
Enough about concepts and abstracts. Here, exactly, is how I identify an overbought or oversold market. My method may, or may not be the ultimate answer to Yin and Yang. However, it is the best I have found considering the irrational character of price action and the ease of constructing the index. As an additional bonus, the index is done on a % basis so you know exactly the nature of an extreme. Overbought/oversold indices that use only the price range from one point to another have no absolutes. Thusly, what was oversold at one time period may not be oversold at another.
I’ll refer to the index as % of R, or Percent R. The index is a simple measure of where today’s closing price fits within the total Range of the last ten days.
Let’s say the range for the last ten days was ten points, with the highest high of the last ten days at 65, and the lowest low of the last ten days at 55.
Today’s closing price is 58. As you can see from the illustration the close is quite low, within context of the total range during the last ten days.
In terms of percentages, the close at 58 represents a figure that is 70% of the total range. Should the commodity have closed at 55, the % would be 100%. That is, the close is 100% of the distance from the top of the range to the close. If prices had closed at 65, the % reading would have been 0 because the distance from the close to 0% of the distance from the high to the close.
The exact formula for arriving at Percent R is first to determine the distance from the highest high of the past ten days and the lowest low of the last ten days. This is the “Range”.
Then, take the difference from the high of the last ten days, which you have already identified, and today’s closing price. We’ll call the “Change”.
All that’s left to do is divide the Change figure by the Range figure and you will arrive at what % today’s price is - out of the past ten day’s range. it’s as simple as that. here’s an example. Let’s say Silver had a high of 280.5 the last ten days and a low of 272.5. Today’s close is 278.5. The Range (high to low) is 80. The Change (today’s close to 10 day high) is 20. When we divide 20 by 80 we arrive at what % today’s closing level represents of the total ten day range. In this case, the Percent R reading is 25%.
Plot this daily reading on your chart paper. It will, naturally, range from a Yang (overbought reading at 0%) to Yin, (an oversold reading at 100%). Generally speaking, readings below 95% give a buy indication - during bull markets. A reading above 10% gives a sell signal during bear markets.
The preceding paragraph is the essence of my technical system. The Percent R index will not work if you insist on acting on thee buy signals during a bear market. Now you realize why I have, in earlier chapters, stressed so strongly, the necessity of isolating the dominant bull and bear markets. Once you have done that, all you have to do is track price movements with Percent R and wait for the signals telling you it’s time to start positioning the commodity according to the fundamental situation we have discussed.
Let’s review some examples of Percent R at work to see its limitations as well as its advantages and historical record. As you will see, it always calls the best buy and sell areas. This is a dandy index.
TIMING YOUR SILVER TRADE
Here’s a chart of December Silver starting on November 17, 1972 through November 1, 1973. During this period, silver was in a well-identified bull market as I repeatedly indicated in my advisory service at the time. This means our interest in the Percent R Index was strictly on the buy side. The signals we would “work” were those given by Percent R dropping below 95%. In total, eight signals were given. All predicted immediate rallies of at least a full cent. That’s a $1,000 profit per contract.
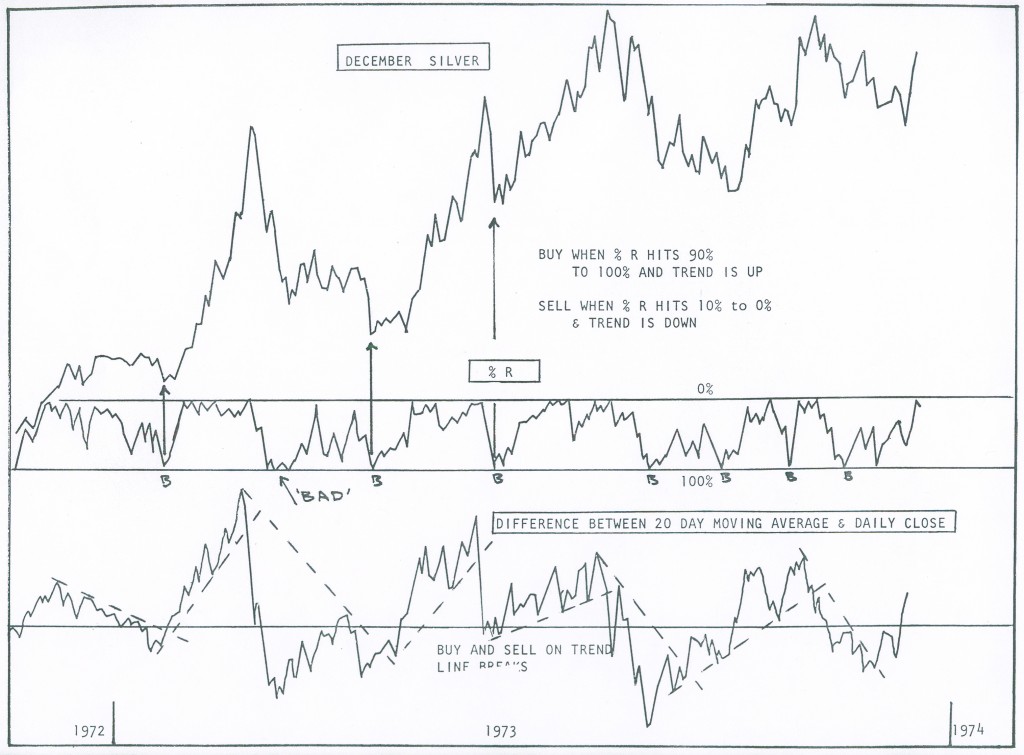
There is one “bad” period which I’ve been careful to mark on this chart. This is an example of when Percent R signals can go haywire. This is the only screening you have to make on a buy signal in a bull market.
If prices have recently undergone an extremely rapid rise, exhibiting signs of a technical blow-off, (that means prices will stage a wild, upside move then immediately limit down without trading) wait for a buy signal from the Percent R Index. You are through waiting and ready to buy, when:
1. Percent R has hit 100%,
2. Five trading days have passed since the 100% reading was hit,
3. Percent R again falls below 95%.
Once those three criteria are met, it’s time to once again begin acting on the Percent R signals, assuming you are buying long in a bull market.
Unless there has been a wild, speculative blow-off in the bull market, you should try to position every time the index falls below95%. This procedure assures that you are buying on extreme weakness at a time Yang is about to overtake Yin.
Not all signals will be correct. I have constructed no perfect indices. The Holy Grail is yet to be found. Because of that, I use a few other tools to confirm the Percent R and I use stops as my ultimate protection. Yet, Percent R remains the best timing tool I have ever used for determining overbought or oversold markets.
SOYBEAN OIL AND SUPER PROFITS
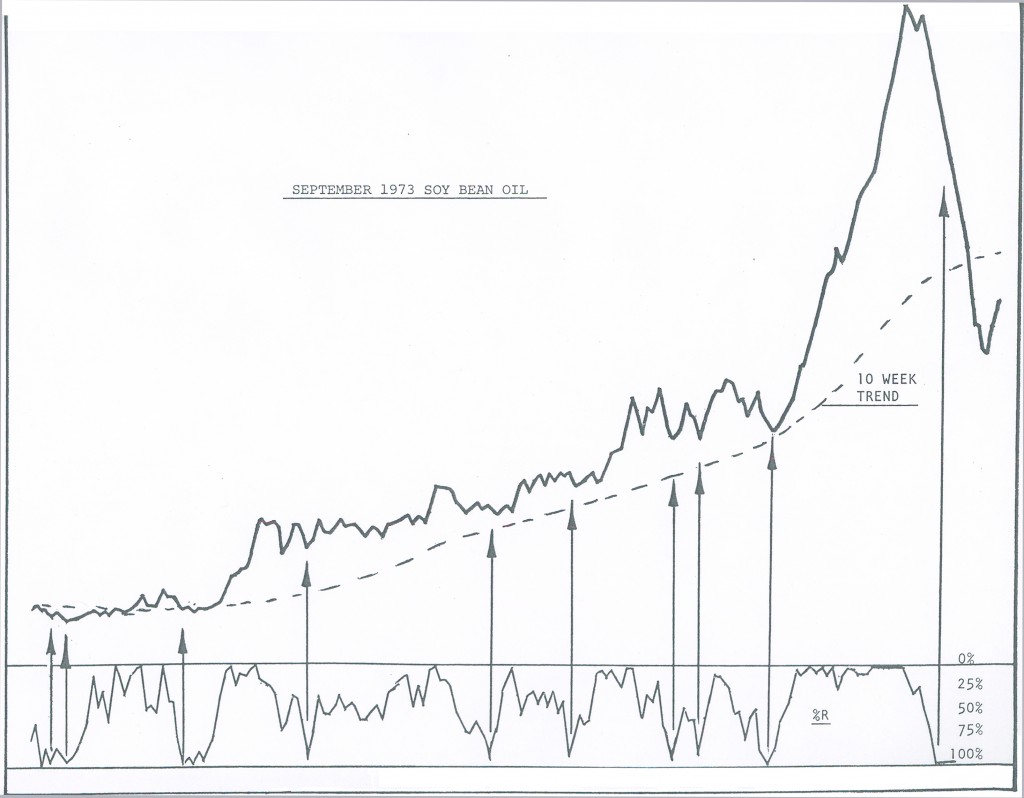 During 1973, Soy Bean Oil was also in an easy-to-identify bull market. Open Interest had several huge reductions. A premium appeared and large traders were long. All signs were “go”. It was only a question of selecting optimum times to buy. Enter, Percent R!
In the ten month chart of Bean Oil prices, ten signals were given by Percent R as I have marked on the chart. All but one of the signals was followed by immediate and substantial gains. That’s not bad! Alert chartists will notice the signals come when prices are extremely weak. Thus, you are almost always able to buy into massive weakness... not after a turn has developed.
Indeed, that’s the beauty of the index. While most gauges wait for a turn to develop. Percent R identifies the exact low point, give or take a day. This means, you can wait until after the signal is given - no need to trade during market hours and place your order for the following morning open when prices are on the skids following through the previous day’s liquidation. That’s a humdinger of a time to take down large, large positions.
THE SECRET OF SELLING SHORT
We reverse our procedures for selling short with Percent R. We look for a well-defined bear market. that means, prices have been trending lower; Open Interest is on the increase, there are no premiums and the nearby months are weaker than the distant. Our next move is to wait for Percent R to zoom up to 10% or less. Notice the beautiful sell signals given in Plywood during the 1973 market period (Yes, Virginia, there were bear markets).
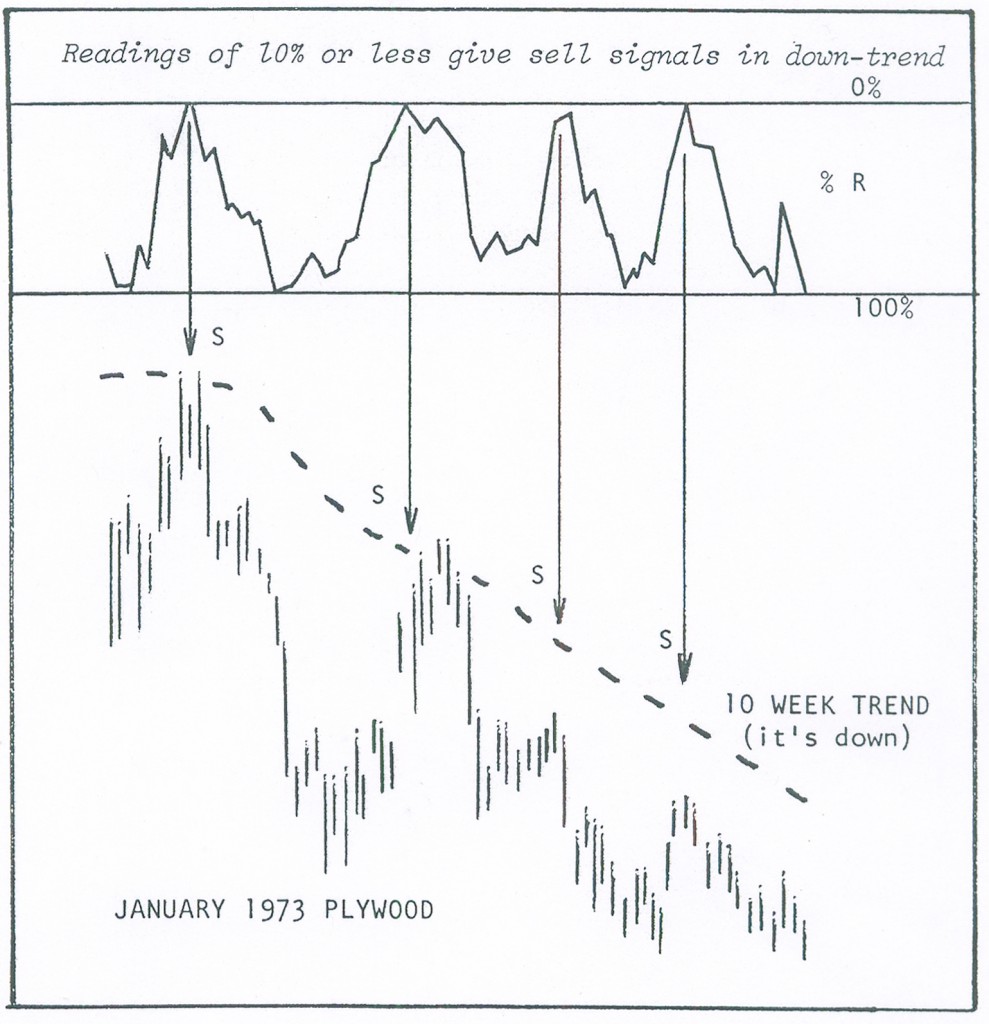 At this point, Yin is about to overtake Yang and market traders begin selling to the newcomers. Here, the exact day of the high was called quite well by Percent R. The index has a great ability to call our attention to many major selling levels in bear markets.
IDENTIFYING A SELLING POINT FOR BEANS
In September, 1973 Soy Bean were in a well-identified bear trend. a quick glance at the chart makes that quite clear. The alter trader was ready to sell short. The question was, when, and could Percent R spot the selling time?
It did in sterling fashion. The tool raised to 11% telling us it was time to short. The next day it was up limit and we had our sell signal at 680. The following day it was all over. Beans took a dive down to the 590 are. Had you sold one contract at 6890 and covered at 590, on a margin of $3,000, you would have had a new gain of over $4,000 just ten days later!
Your bear market strategy using Percent R will be to wait until Open Interest has had a sizable increase (while prices remain in the bear market), and then Percent R hits the selling area at 10% or less. The final indication that you should pull the trigger comes the day after Percent R gives the sell signal.
Let ’em have it with both barrels. Place your stop, walk away. Your work is done for the time being!
HOW TO HANDLE TRADING RANGES
Most technical systems are butchered during trading ranges. How about Percent R? Well, as a matter of record, it was designed to help me as it identified the tops and lows of trading range markets with explicit exactness.
March 1973 Sugar is a good example of an extended trading range market. My work gave convincing evidence prices would go higher. Yet, in a trading range, a buy and hold strategy is not as successful as a buy and sell policy.
During such situations you buy when the Percent R hits 90% or lower. Sell and short when it bounces back in the 10% range. You will find an amazing degree of correlation between trading range tops and Percent R peaks. Ditto for bottoms.
Trading ranges mean prices are locked into supply on the topside and demand, underneath. Usually, supply comes in with a high Percent R reading and demand returns when Percent R falls back to the low buy area.